Disconnected data, recurring manual tasks, and limited system flexibility often hinder timely and accurate reporting. You need a data analytics tool to help – and there are plenty of options out there. Is KNIME an option that you should consider?
What is KNIME?
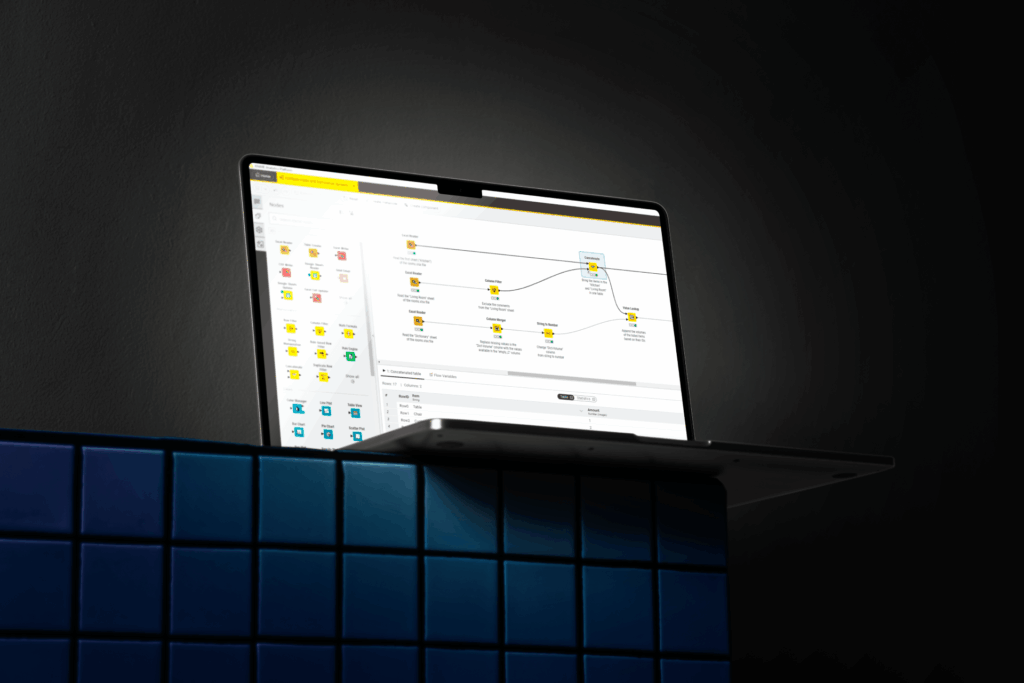
KNIME is a free and open-source data analytics platform. In a way similar to Alteryx, it provides a visual, low-code/no-code environment for data access, blending, analysis, and visualization, making it a handy tool to both beginners and experienced users. Users can build workflows by connecting graphical icons, called nodes, which represent individual data processing steps.
What’s great about KNIME
Transparent, Visual Workflow Design
By far KNIME’s greatest strength is the node-based visual interface. This means that you can design, document, and maintain repeatable processes without any programming expertise. For VAT professionals, this means building end-to-end workflows that cover data ingestion, cleansing, classification, validation, and export — while maintaining full transparency and auditability. Essentially, you can deploy fast and iterate with minimal costs and adapting your compliance processes without having to turn this into an IT project. Ownership remains with the tax team.
Full Integration with Enterprise Systems
KNIME supports integration with a very wide array of data sources – be them cloud-based or local. Locally, you can start with Excel files, or all sorts of other formats (text, CSV, audit file .xaf, etc.) – however, there are powerful nodes/connectors to make your data available from a lot of other sources. Out of the box, you can import and export data to and from your SharePoint environment, Google Drive and Spreadsheets. There are also connectors for ERP systems (for example, the commercially available SAP connector node created by Theobald Software, as well as free integrations with most data visualization tools, such as PowerBI or Tableau. You can import from multiple sources, normalize data, and export to various formats, generating automated reports, statistics and visualizations.
Speaking of Power BI and Tableau, it’s important to clarify that these tools serve a different purpose than KNIME — they focus on data visualization and dashboarding, whereas KNIME is designed primarily for data preparation, analysis, and workflow automation. KNIME shines when you are dealing with complex ETL (Extract, Transform, Load) operations, statistical analysis, and rule-based logic. It is the backstage crew making sure your data is polished, structured, and ready for showtime.
On the flip side, Power BI and Tableau are data visualization tools. These tools are built to take clean, structured data and turn it into interactive dashboards, charts, graphs, and business insights for decision-makers. They let you explore data visually, drill down with filters, and present insights in a business-friendly way. But they rely heavily on having data that is already prepped — they are not made for deep data cleaning or modeling logic beyond what is available in their built-in calculated columns.
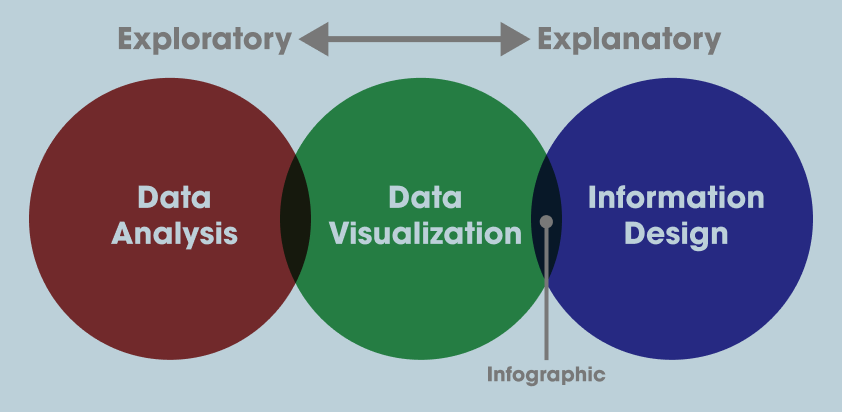
KNIME is mainly a data analysis tool, while PowerBI, Tableau and other solutions are mainly data visualization tools.
In short: KNIME is where you prepare the data, Power BI and Tableau are where you present it. KNIME is the kitchen; Power BI and Tableau are the restaurant plating the dish.
Scalable and customizable
One very significant plus of KNIME is that it has something for everyone. You can start small, data cleaning a single file, or you can go big, implementing machine learning and anomaly detection algorithms. It is quite easy to scale and expand depending on your needs – as long as you know the direction that you want to head towards, sky is the limit. For heavy tasks, we suggest relying less on „vanilla” nodes and building custom functionalities using Python, R, and the many available data science libraries – all supported in KNIME.
There are a few challenges, however
Challenging Learning Curve
Although KNIME is accessible to users without a coding background, it does require a baseline understanding of data workflows, logic structures, and data types. Compared to some more commercial, business-user-oriented tools, onboarding new users may require additional training and documentation. For example, Alteryx – another data analysis tool, similar to KNIME in its block-based approach – is generally more user friendly, especially towards beginners. Also, connectors provided by KNIME (the “nodes”) are much more granular, providing better and more complex control in the long run; however, this translates to a steeper learning curve in the beginning.
Interface and Collaboration Constraints
Collaboration is possible via KNIME Server or via integration with version control systems, but it is important to note that it is not as seamless as in platforms specifically built for collaborative business analytics or dashboarding. If you are thinking of working together on the same flow as you would normally do in an Excel sheet on SharePoint, KNIME in its basic configuration is not the best option.
Limited Native Reporting Features
While KNIME excels at data processing and analysis, its capabilities in terms of visualization and report generation are limited. We have often seen organization that pair KNIME with reporting tools such as Power BI, Tableau, or even Excel to fulfill their presentation and communication needs. This adds an additional layer to the reporting workflow but also offers flexibility in choosing the most appropriate reporting format.
Should KNIME be your to-go tool?
KNIME represents a compelling option for any professional seeking to enhance their VAT compliance processes through data analytics. It combines transparency, flexibility, and powerful automation with the ability to scale into more advanced analytical use cases. While it may require some initial investment in training and infrastructure, the long-term benefits—in terms of reduced compliance risk, improved efficiency, and data-driven decision-making—make it a valuable asset for forward-thinking tax departments, especially when considering the fact that using KNIME is free regardless of how many users you have (Alteryx, for example, charges around EUR 5k/year per license/user).
If you are looking at ways of starting to implement tools like KNIME or Alteryx into your daily work, feel free to get in touch with us for a coffee chat! We are more than happy to provide tips, tricks, advice and to help you develop the systems that drive manual corrections out for good.